
Today, so most articles will tell you, if you’re not all in on social media, you’re doing marketing wrong. Worse than this, you’re a luddite.
You just don’t get that the world has changed. B2B buyers have moved on. They’re much more likely to check out Twitter and LinkedIn than read your lame white paper or latest ebook.
And email? Pah!
As a result, you need to get over yourself, stop selling and start engaging them on their terms, where they hang out online. You need to create great, click-worthy content that can be shared on social media. You need to make it bite-sized, snackable. And you need to take advantage of all the news-jacking, listicle, ‘What David Bowie taught me about the enterprise technology stack’ techniques that amp up your likes and shares.
In fact, you really should be thinking about moving on from traditional social media, the real action is now on <insert latest bright shiny thing>.
As a result, the number of B2B social media marketers has exploded. They’re blogging, tweeting, sharing and engaging their communities. The costs are pretty low in hard cash terms (until they take the pay-to-play options) but they’re investing masses of time and effort into making this work.
As most will cheerfully admit, no one has all the answers. This is an ever-changing discipline. In fact, key to success is that you keep experimenting – because, what works today won’t necessarily work tomorrow.
While it’s true that social media is a rapidly evolving space, we’re now a number of years into the social revolution. And while many (especially in B2B) were a little late to the party, we should now be seeing some pretty reliable evidence of just how well social media is delivering.
The next question is, of course, how to measure results. In the early days, measurement tended to be focused on social media metrics themselves – shares, likes etc. This may have been developed further into reach and engagement. But, fundamentally, it was about how well any individual brand’s content and communications was performing in social media itself.
More recently, attitudes have hardened somewhat.
Boards are looking at social activity and asking precisely what it’s doing for the business. That is, is it converting into leads and ultimately sales?
This is a tougher exercise. Outbound campaign activities can track leads pretty effectively – we monitor everything and traffic is generally driven to specific landing pages. But while B2C marketers have some great attribution tools, in complex sales with multiple decision makers it can be difficult to trace back effectiveness to a social Typhoid Mary.
But what if we simply look at a metric such as website traffic? This would demonstrate some tangible movement towards greater engagement with the brand and its products and services. It is, of course, nowhere near perfect but, if nothing else, it’s an interesting exercise.
to do this, we thought we’d look at just how much web traffic social drives to leading technology and professional services firms.
Now, getting access to this data can be a little tricky. However, by all accounts, Similarweb is reasonably accurate in estimating figures on relative sources of traffic (at least accurate enough for our rough and ready exercise here). So we looked at the stats for the top 10 companies on Nasdaq and the top 10 professional services firms as rated by Accountancy Age.
Let’s start with the tech firms…
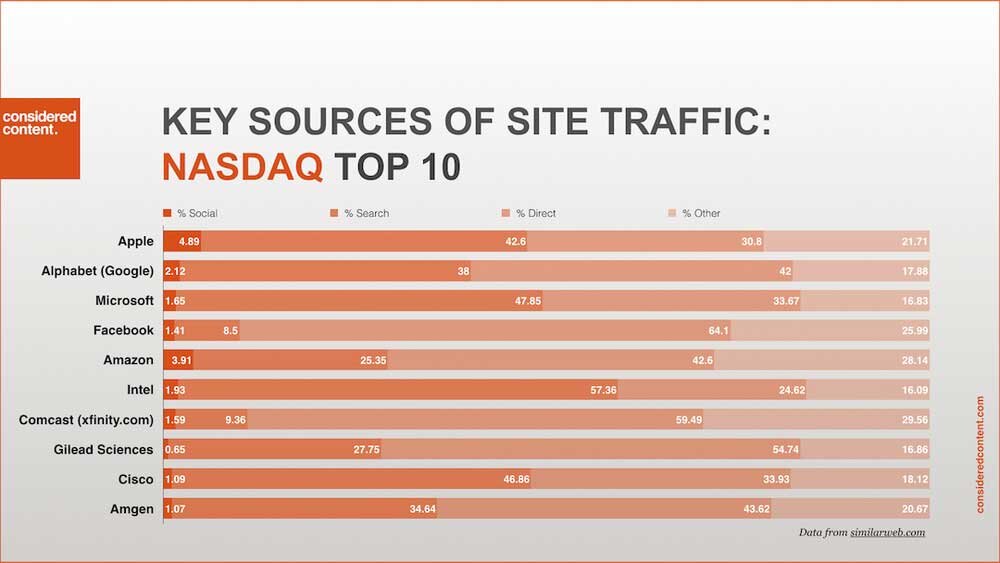
This was a surprise. I don’t know about you, but as a guess, I’d have expected most of the leading tech companies to be nudging up around 10% of their traffic coming from social media. To me, that feels about right given all the noise and the fact that, in B2B, technology companies tend to be early adopters.
Ironically, the top performer is Apple, a brand famous for doing not very much in the social space. They hit the heady heights of 4.89% of traffic coming from social. This goes to show the power of a strong brand – if brand is less about what you say about yourself and more about what others say about you, Apple is reaping the rewards.
In second place comes Amazon with 3.91% from social. Here we may be getting some bleed-over from the B2C/e-commerce side of the business (I’d be very surprised if the Amazon Web Services part of the organisation sees that much traffic from social).
Third is Alphabet (the holding company for Google) with 2.12%. The irony here is that most of their traffic (42%) comes direct and not via search.
None of the other seven breaks through the 2% barrier – so from top to bottom, it reads: Intel (1.93%), Microsoft (1.65%), Comcast/Xfinity (1.59%), Facebook (1.41%), Cisco (1.09%), Amgen (1.07) and Gilead Sciences brings up the rear with 0.65%.
So what about professional services?
Now, despite the great strides being made by a number of professional services firms in content marketing and thought leadership (not to mention their industrial-scale recruitment efforts), I’d expect them to perform a bit worse than the tech companies in driving traffic from social. What can I say, it’s a prejudice.
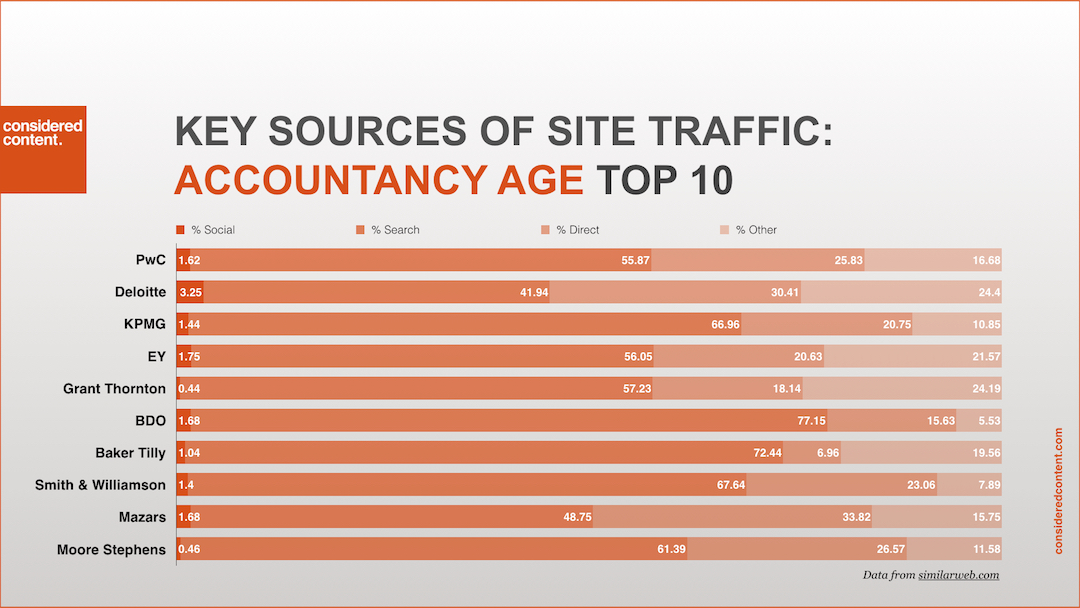
Looking at the average traffic from social media across the top 10, for professional services firms this stands at 1.48% (compared to 2.03% for the tech firms). So not a massive difference.
The leader in professional services is Deloitte with 3.25% (the only firm to exceed 2%) which may be a reflection of the brand’s increasing focus on the digital world and extensive content creation.
Second comes EY (formerly Ernst & Young) with 1.75% and, tying for third on 1.68%, are BDO and Mazars.
The rest? PwC (1.62%), KPMG (1.44%), Smith & Williamson (1.4%), Baker Tilly (1.04%), Moore Stephens (0.46%) and finally Grant Thornton on 0.44%.
Overall, the vast majority of professional services traffic comes via search (in tech it’s more evenly split between search and direct). Again, this may be a reflection of their focus on creating thought leadership-style content.
Ok, what about those businesses that have really committed to the whole notion of social – the MarTech companies?
If anyone is really showing the strength of social media marketing, it’s these guys. They’re the ones really spending the time and money to grow significant followers and engage with them on a day-to-day (minute-to-minute) basis.
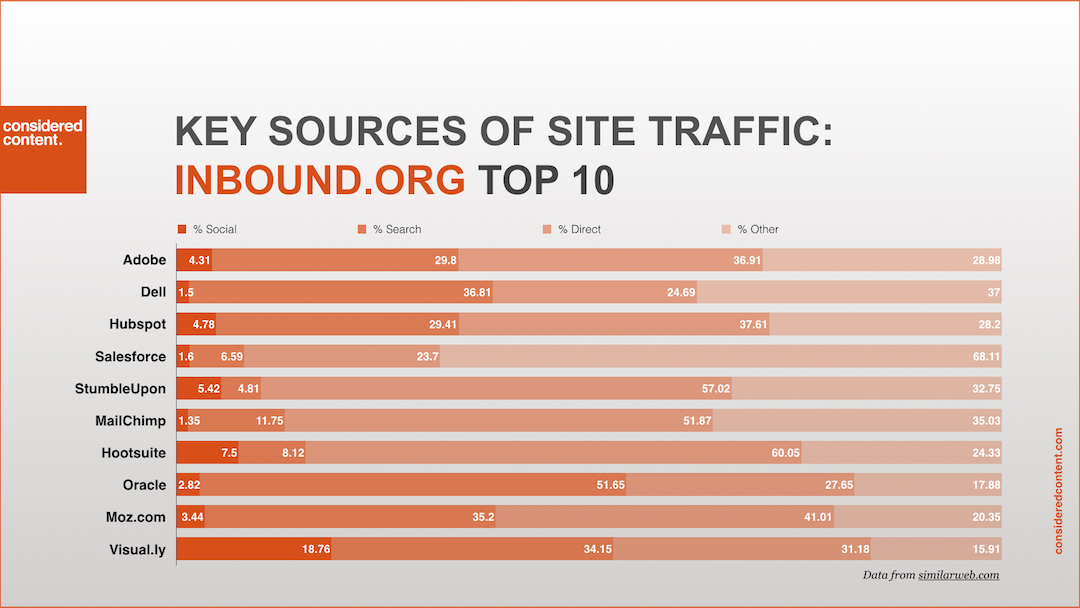
To get a selection to analyse, we turned to inbound.org’s list of the top MarTech companies. This is determined based on scores across Twitter followers, Facebook fans, Buzz and search authority.
So what did we find?
The clear winner is Visual.ly, blowing the other nine away with 18.76% of its traffic coming from social media. The brand has built up 138k Twitter followers and 177k Facebook fans – though this is far less than some far worse performing brands in the top 10. In fact, it stands at number 10 on inbound.org’s list. Unless these figures are skewed by something like their content for clients being hosted by them and linked to direct, whatever they’re doing, they’re doing it right.
In second place comes Hootsuite on 7.5% (with 7m Twitter followers and 562k Facebook fans) – still creditable by the standards we’ve seen in the Nasdaq and Accountancy Age lists. Considering how core social media is to Hootsuite’s business, a poor showing here would be pretty damning.
Third comes StumbleUpon on 5.42% (with 91.4k Twitter followers and 653k Facebook fans). Again, their business is centred around people using their service to find and share content so you’d certainly hope they’d do well.
No-one outside the top three manages to exceed the 5% mark however, the rest of the top 10 reads: Hubspot (4.78%), Adobe (4.31%), Moz.com (3.44%), Oracle (2.82%), Salesforce (1.6%), Dell (1.5%) and MailChimp (1.35%).
There could, of course, be a multitude of conclusions to be drawn from this analysis.
Maybe the data is wrong. It is, after all, an estimation (even though Similarweb is generally seen to be pretty accurate). If this is the case, these brands could be doing way, way better than the data suggests.
Maybe our expectations are too high. Maybe the above results are good and reflect a positive result for the amount of cost and effort that’s going into them.
Maybe we’re measuring the wrong thing. It could easily be argued that we should be looking at what’s happening on the social networks themselves.
It could be claimed that this is where the real action is because today’s B2B customers are spending more time on these networks precisely to avoid brands’ own highly controlled sites. (For example US firm PerkinElmer is cited by Trackmaven as having exceptional engagement on Facebook with 89.45 interactions per post per thousand followers, yet Similarweb rates its social traffic at just 0.58%.)
Maybe we’re not factoring in ‘dark social’ – traffic that simply cannot be currently tracked. Possible, but if feels a little too much like a get out of jail free card for my liking.
Recent research by Vanson Bourne found that while 94% of tech marketers are using social, only 2 to 3% thought they were doing it extremely well. And it is taking a lot of their time. As one respondent noted: “Social media [is] a big time suck for a marketing department. The tactics have changed [but] the buyer and the way they buy hasn’t changed.”
So what do you think?

Jason Ball is the founder and managing director at Considered. With a multi-decade career in B2B marketing, he’s worked with world-leading brands such as Adobe, Google, EY and Cisco together with niche specialists in technology, manufacturing and professional services.